1 Welcome to R
“I believe that R currently represents the best medium for quality software in support of data analysis.”
- John Chambers, Developer of S
“R is a real demonstration of the power of collaboration, and I don’t think you could construct something like this any other way.”
- Ross Ihaka, original co-developer of R
1.1 What is R?
R is a computer language and an open source setting for statistics, data management, computation, and graphics. The outward mien of R is minimalistic, with few menu-driven interactive facilities (no menus exist for some implementations of R). This is in contrast to conventional statistical software consisting of black box, menu-dominated, often inflexible tools. The simplicity of R allows one to easily evaluate, edit, and build procedures for data analysis, and many other purposes.
1.2 R and Biology
I am a statistical ecologist, so this book was written with natural scientists, particularly biologists, in mind. R is useful to biologists for three major reasons. First, it provides access to a large number of cutting edge statistical, graphical, and organizational procedures, many of which have been designed specifically for biological research. Second, biological datasets, including those from genetic and spatiotemporal research can be extensive and complex. R can readily manage and analyze such data. Third, analysis of biological data often requires computational flexibility. R allows one to “get under the hood”, look at the code, and check to see what algorithms are doing. If, after examining an R-algorithm we are unsatisfied, we can generally modify its code or create new code to meet our specific needs.
1.3 Popularity of R
Because of its freeware status, the overall number of people using R is difficult to determine. Nonetheless, the R-consortium website estimates that there are currently more than two million active R users. The r4stats website houses up-to-date surveys concerning the popularity of analytical software. These surveys (accessed 06/18/2026) indicate that R is often preferred among data scientists for big data projects and data mining. R is also one of the most frequently cited analytical systems in scholarly articles, one of the most frequently used languages at the GitHub repository, and one of the most frequently discussed languages on Stack Overflow. In 2025 the R language was ranked 11th in the world by the Institute of Electrical and Electronics Engineers (IEEE), and was recently (10/25/2025) ranked 6th by the PopularitY of Programming Language (PYPL) index4. Further, in a 2017 survey, based on Stack Overflow queries, R was the “least disliked” programming language. The growth and popularity of R can be partially tied to its relatively straightforward extendability via user generated functions and packages. This characteristic prompts a strong sense of community among R-users, along with a practical need for the perpetuation and upkeep of the R system. While trailing Python, there are currently over 20,000 formally contributed R-packages at the Comprehensive R Archive Network (CRAN).
1.4 A Brief History
R was created in the early 1990s by Australian computational statisticians Ross Ihaka and Robert Gentleman (Fig 1.1) to address scope5 and memory use deficiencies in its primary progenitor language, S (Ihaka and Gentleman 1996). Ihaka and Gentleman used the name R both to acknowledge the influence of S (because r and s are juxtaposed in the alphabet), and to celebrate their own personal efforts (because “R” was the first letter of their first names).
 and the [Alchetron
Free Social Encyclopedia](https://alchetron.com/Robert-Gentleman-(statistician)), respectively.](figs1/ihaka_gent.jpg)
FIGURE 1.1: Ross Ihaka (1954 - ) (L) and Robert Gentleman (1959 - ) (R), the co-creators of R. L- and R-hand photos retrieved October 27, 2025, from facebook.com and the Alchetron Free Social Encyclopedia, respectively.
At the insistence of Swiss statistician Martin Maechler (Fig 1.2l), Ihaka and Gentleman distributed the R source code in 1995 under the Free Software Foundation’s GNU general license (Ihaka 1998). Because of its relatively easy-to-learn language, R was quickly extended with code and packages developed by its users. The rapid growth of R gave rise to the need for a group to guide its progress. This led, in 1997, to the establishment of the R-development core team6, an international panel that modifies, troubleshoots, and manages source code (Fig 1.2).
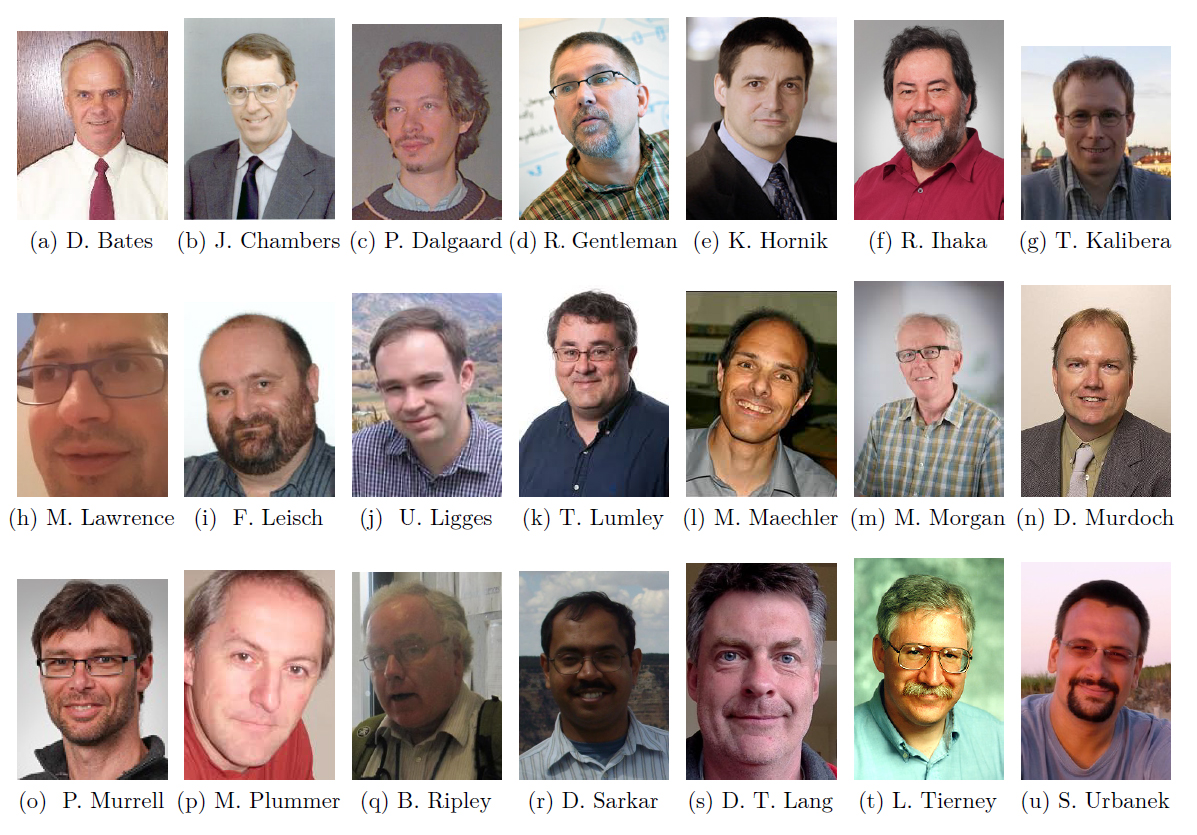
FIGURE 1.2: A recent version of the R-core development team. Photos obtained from a variety of open source websites.
1.4.1 Development of the R Language
The R language is based on older languages, particularly S, developed at Bell Laboratories (Becker and Chambers 1978; Becker and Chambers 1981; Becker et al. 1988), and Scheme (Steele 1978; Sussman and Steele Jr 1998; Abelson and Sussman 2022), a dialect of Lisp7 (McCarthy et al. 1960; McCarthy 1978), which was developed at the MIT artificial intelligence laboratory beginning in the late 1950s (Fig 1.3).
 on 06/18/2026.](figs1/mccarthy.jpg)
FIGURE 1.3: John McCarthy (1927-2011), creator of the Lisp language, and the first to coin the term artifical intelligence, working at the Stanford AI laboratory in 1974. Photo by Chuck Painter. Retrieved from the Stanford University Engineering School website on 06/18/2026.
In the appendix to his book Software for Data Analysis, John M. Chambers (Fig 1.2b), a primary developer of S, recounts the unique evolution and goals of S from its inception in 1976. Chambers notes that S was originally intended to be an analysis toolbox solely for the statistics research group at Bell Labs, consisting of roughly 20 people at the time. It was decided that S (initially known as “the system”8) would have fundamental extensibility9, reflecting the Bell Labs’ philosophy that “collaborations could actually enhance research” (Chambers 2008)10. The S language definition, and details concerning the fitting and application of S statistical models are given in Becker et al. (1988) and Chambers and Hastie (1992), respectively11.
S was designed to diminish inner functional details of its underlying C and Fortran12 algorithms while making important higher-level processes more readily accessible and interactive. The inspiration for these goals was the exploratory data analysis approach of John Tukey (Fig 1.4), who was a contemporary of Chambers and other S developers13 at Bell Labs (Chambers 2020). In a 1965 Bell Labs memo (15 years before the release of S) Tukey noted that modern statisticians found themselves in a “peaceful collision of computing and data analysis” (Chambers 1999).
![John Tukey (1915-2000), widely known for achievements in mathematical statistics, including the fast Fourier transform [@cooley1965], tools in exploratory data analysis, including the boxplot [@tukey1977], and computer science where he coined the term *bit*, as a unit of binary information and memory [@shannon1948]. Because of his role as a data analyst at Bell labs, Tukey possessed prescience concerning **S** and **R**. Photo obtained from the blogspot [Unbiased Research](https://unbiasedresearch.blogspot.com/2016/04/john-wtukey-playing-in-everyones.html) on 06/18/2026.](figs1/Tukey.jpg)
FIGURE 1.4: John Tukey (1915-2000), widely known for achievements in mathematical statistics, including the fast Fourier transform (Cooley and Tukey 1965), tools in exploratory data analysis, including the boxplot (Tukey et al. 1977), and computer science where he coined the term bit, as a unit of binary information and memory (Shannon 1948). Because of his role as a data analyst at Bell labs, Tukey possessed prescience concerning S and R. Photo obtained from the blogspot Unbiased Research on 06/18/2026.
An adherence of S to exploratory data analysis was evident in the high-quality and flexibility of its graphics devices and its easily-accessible function documentation. Built-in documentation does not exist for many important languages, including C and C++.
The initial programmatic objectives of S are apparent in an early design sketch that describes an outer ‘user interface’ layer to core Fortran algorithms that ultimately produces an S object (Fig 1.5). The underlying philosophical principles and programmatic foundations of S have strongly affected the development of R (Chambers 2020).
![First designs for the **S** statistical system, *circa* 1976 [@chambers2008]. Written in the lower lefthand corner is the important note: ‘Names are meaningful to algorithm, not necessarily to language.’ Figure taken from a historical Appendix to @chambers2008.](figs1/Ssketch.png)
FIGURE 1.5: First designs for the S statistical system, circa 1976 (Chambers 2008). Written in the lower lefthand corner is the important note: ‘Names are meaningful to algorithm, not necessarily to language.’ Figure taken from a historical Appendix to Chambers (2008).
S evolved alongside the Unix operating system (also developed at Bell Labs) which currently underlies Macintosh and Linux (free-Unix) operating systems14. An early inception S was written for Unix, allowing S to be portable to any machine using Unix. Both S and Unix were quickly commercially licensed by AT&T for university and third party retailers. The academic licensing and distribution of S attracted a large number user groups in 1980s. However, the lack of a clear open source strategy caused many early users to switch from S to R in the 1990s. S was purchased by Insightful\(^{\circledR}\) software in 2004 to run the commercial software S-Plus\(^{\circledR}\). In 2021 S-Plus\(^{\circledR}\) morphed to include TIBCO connected intelligence software, with some R open source applications.
1.4.1.1 R is Born
The original Scheme-inspired R interpreter consisted of roughly 1000 lines of C15 code, driven by a command line interface that used a syntax corresponding to S, resulting in “a free implementation of something ‘close to’ version 3 of the S language (S3)” (Ihaka 1998). The R and S languages remain very similar, and code written in S can generally be run unaltered in R. The method of function implementation in R, however, remains more similar to Scheme. The official language definition of the current version of R can be found at the CRAN website, along with other sources of complementary information.
1.4.1.2 Differences of R and S
S3 and the initial release of R differed in two important ways (Ihaka and Gentleman 1996)16. First, the R-engine was given a fixed amount of memory at start up. This was in contrast to S, which adjusted available memory to session needs. Among other things, this difference meant more available pre-reserved computer memory, and fewer virtual pagination17 problems in R (Ihaka and Gentleman 1996). It also made R faster than S for many applications (Hornik and R Core Team 2023). Second, R variable locations are lexically scoped. In computer science, variables are storage areas with identifiers, and scope defines the context in which a variable name is recognized. So-called global variables are accessible in every scope (for instance, both inside and outside functions). In contrast, local variables may only exist within particular localized scopes18. Lexical scoping allows functions in R access to variables that were in effect when the function was defined in a session. The characteristics of R functions and details concerning lexical scoping are formally addressed in Ch 8.
1.4.2 Recent Developments
It is apparent that R can be tied (via linkages with Fortran and Lisp) to foundational benchmarks in software engineering, and (via John Tukey and others) to key figures in data science. Today R remains at the forefront of computational advances, including implementations for High Performance Computing (HPC, Section 12.11.2), and Artificial Intelligence (AI) (Lantz 2015; Ramasubramanian and Singh 2017; Kuhn and Wickham 2020), including Large Language Models (LLMs) (Wickham, Cheng, et al. 2025) (see Section 12.12).
1.4.2.1 APIs and IDEs
Conventional R usage has changed dramatically from its inception, because of: 1) the increased availability of refined Application Programming Interfaces (APIs) –that provide programmatic connections between R and other languages and software (Section 9.1), and 2) Integrated Development Environments (IDEs) –that facilitate software development using the R language (Section 2.8.3).
Widely used R language APIs include the Rcpp interface for C++19, written primarily by Dirk Eddelbuettel (Fig 1.6) and Romain Francois (Eddelbuettel, Francois, Allaire, et al. 2023), and the Java20 tool rJava (Urbanek 2021). Important R packages for interacting with web APIs include jsonlite (Ooms 2014), which maps between R and JSON21 data and rvest (Wickham 2025), a tool for web scraping.

FIGURE 1.6: Dirk Eddelbuettel, a quantitative software developer and maintainer of the important Rcpp and Rinside packages. Photo from https://stat.illinois.edu/directory/profile/deddel, retrieved on 06/18/2026.
Currently, the most popular IDE for R is RStudio (Section 2.10). RStudio facilitates the creation and debugging of of R code, and streamlines complex processes including interfaces with other languages and the generation of HTML-based reports and web applications. A number of current (or former) RStudio developers have been integral in advancing the capabilities of R. These individuals include Yihui Xie (Fig 1.7), author of the knitr, bookdown, and rmarkdown packages, and Hadley Wickham (Fig 1.8), chief scientist at Posit/Rstudio, author of many useful books on R programming, and progenitor of the tidyverse library of packages.
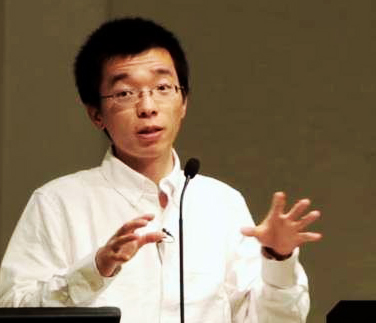
FIGURE 1.7: Yihui Xie, statistian, former software wizard at Posit/Rstudio, and author of many important R packages including animation, bookdown, knitr, and rmarkdown, among others. Photo from https://alchetron.com/Yihui-Xie, retrieved on 06/18/2026.
1.4.2.2 The tidyverse
According to Thieme (2018), many R-users “have little interest in becoming computer scientists,” and are “less interested in the mechanics of R than in what R allowed them to do.” These individuals (and many others) have been drawn to the tidyverse library (Wickham et al. 2019), which includes the deservedly popular ggplot2 and dplyr R packages (Ch 5). The creation of grid graphics (see Ch 7) is greatly simplified in ggplot2, through the existence of well conceived themes and defaults. Further, operations in the tidyverse are often amenable to highly readable scripts, based on pipes and continuation prompts.

FIGURE 1.8: Hadley Wickham (1979 - ) tidyverse progenitor and chief scientist at Posit/Rstudio. Photo from https://x.com/hadleywickham, retrieved on 06/18/2026.
1.4.3 The Future of R
The future of R will largely be determined by the formal and informal community of users who have donated years of their lives to its development without monetary compensation. Importantly, the continued growth of R will require adaptation to the changing demography of R-users. Like most software endeavors, R has been historically male dominated (Fig 1.2). However, this has been changing rapidly. As an example, the R Ladies group, founded in 2012 by Gabriela de Queiroz (Fig 1.9), currently (8/6/2024) has 225 chapters in 65 countries, and more than 100,000 members worldwide.
 and founder of the [**R** Ladies group](https://rladies.org/). Photo from https://k-roz.com/about/, retrieved on 06/18/2026.](figs1/gabriela.jpg)
FIGURE 1.9: Gabriela de Queiroz, Ex-director of AI at Microsoft for Startups and founder of the R Ladies group. Photo from https://k-roz.com/about/, retrieved on 06/18/2026.
Other important recent female contributors to R include Dr. Jenny Bryan (Fig 1.10a), a tidyverse developer and manager of the R packages reprex and googlesheets, Dr. Di Cook (Fig 1.10b) a statistics professor at Monash University (where she supervised both Hadley Wickman and Yihui Xie) and board member of the R foundation, and Dr. Heather Turner (Fig 1.10c), a 2026 addition to the R core team, and manager of the packages gnm, BradleyTerry2, and PlackettLuce.
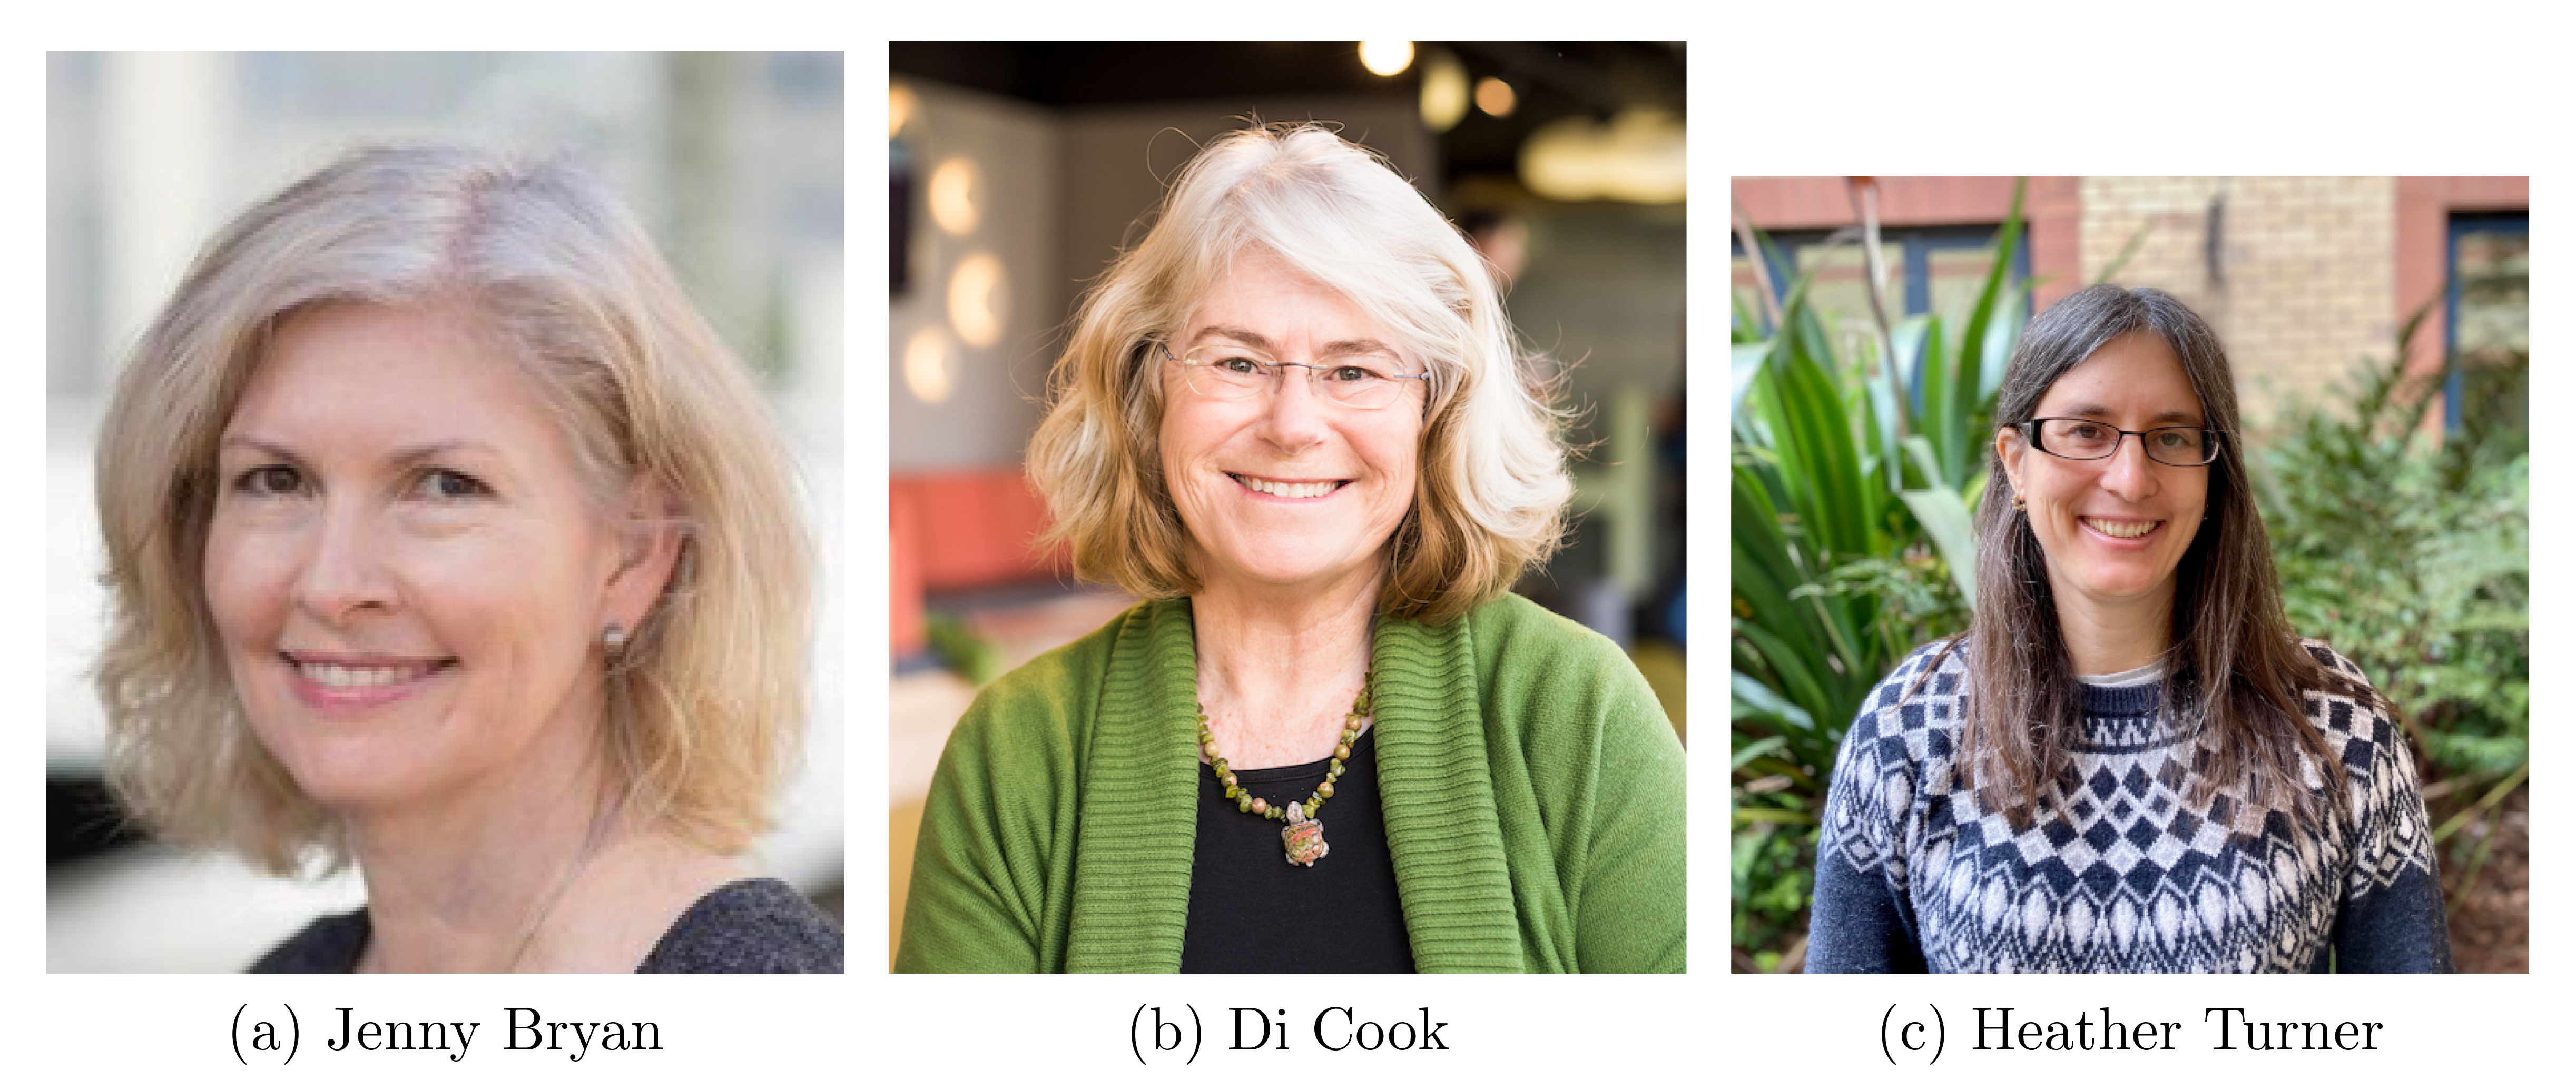
FIGURE 1.10: Important female contributors to R. Photos from https://education.rstudio.com/trainers/people/bryan+jenny/, https://statsocaus.github.io/dicook-award/about.html, https://warwick.ac.uk/fac/sci/statistics/staff/academic-research/turner/, retrieved on 06/18/2026.
1.5 Copyrights and Licenses
R is intentionally open-source and free. Thus, there are no warranties on its implementations and packages. As its copyright framework R uses the GNU (a recursive acronym for GNU is not Unix) General Public License (GPL). This allows users to share and change R and its functions. The associated legalese can be read after typing RShowDoc("COPYING") in the R-console. Because its functions can be legally (and easily) recycled and altered we should always give credit to developers, package maintainers, or whomever wrote the R functions or code we are using.
1.6 R and Reliability
The lack of an R warranty has frightened away some scientists. But be assured, with few exceptions, R works as well or better than “top of the line” analytical commercial software. Indeed, statistical software giants SAS\(^{\circledR}\) and SPSS\(^{\circledR}\) have made R applications accessible from within their products (Fox 2009), and R processes and files can be shared directly with Microsoft Excel\(^{\circledR}\) and other proprietary software. For specialized or advanced statistical techniques R often outperforms other alternatives because of its diverse array of continually updated applications.
The computing engines and packages that come with a conventional R download (see Section 3.10) meet or exceed U.S. federal analytical standards for clinical trial research (Schwartz et al. 2008). In addition, core algorithms used in R are based on seminal and well-trusted functions. For instance, R random number generators include some of the most venerated and thoroughly tested functions in computer history (Chambers 2008). Similarly, the Linear Algebra PACKage (LAPACK) algorithms (Anderson et al. 1999) used by R, are among the world’s most stable and best-tested software.
1.7 Installation
To install R, first go to the website (http://www.r-project.org/). On this page specify which platform you are using (Fig 1.11, step 1). R can currently be used on Unix/Linux, Windows and Mac operating systems. Once an operating system has been selected, one can click on the “base” link to download the pre-compiled base binaries if R currently exists on your computer. If R has not been previously installed on your computer click on “Install R for the first time” (Fig 1.11, step 2). You will be delivered to a window containing a link to download the most recent version of R by clicking on the “Download” link (Fig 1.11, step 3). Two versions of R are generally released each year, one in April and one in October. Archived, older versions of R and R packages are also available from CRAN.
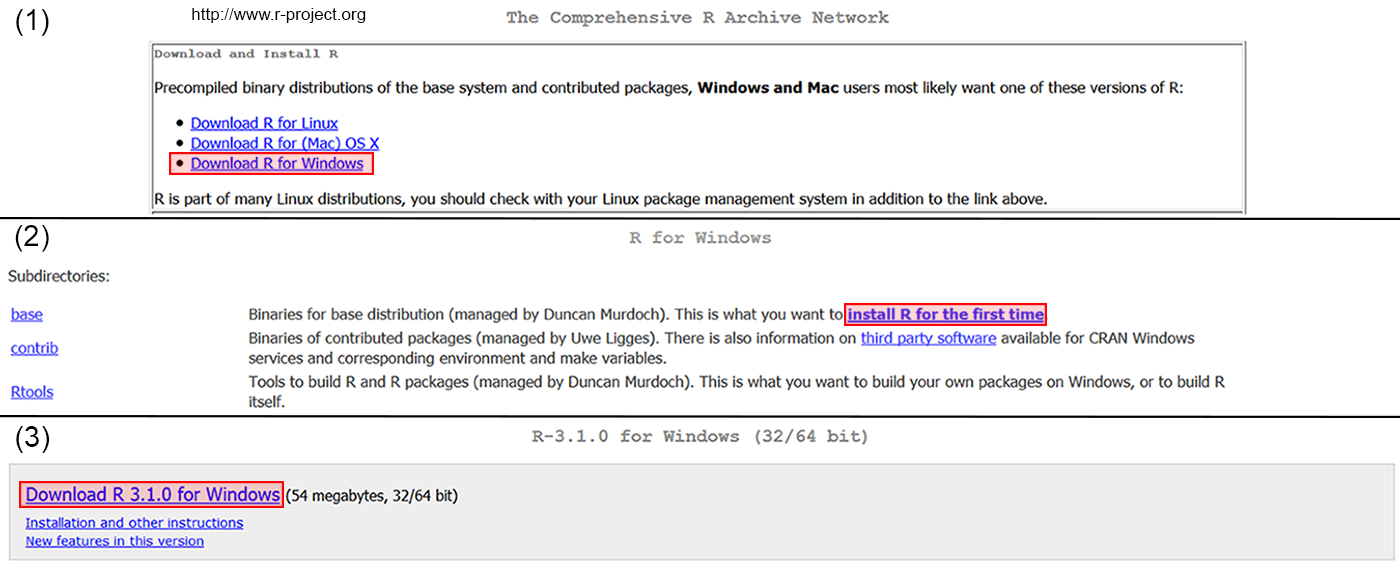
FIGURE 1.11: Method for installing R for Windows for the first time.
Exercises
- The following questions concern the history and general characteristics of R.
- Who were the original creators of R?
- What are some major developmental events in the history of R?
- What languages is R derived from and/or most similar to?
- What features distinguish R from other languages and statistical software?
- What are the three major operating systems R works with?
- Briefly consider R in the context of major historical events in computer software and artificial intelligence.